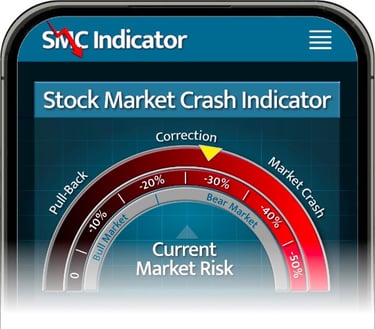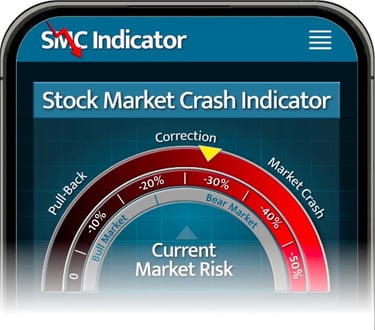
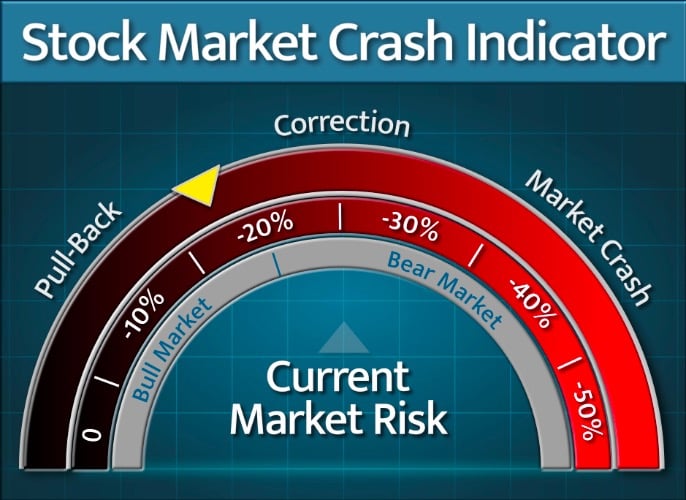
Stock Market Crash Indicator monitors the current market crash risk
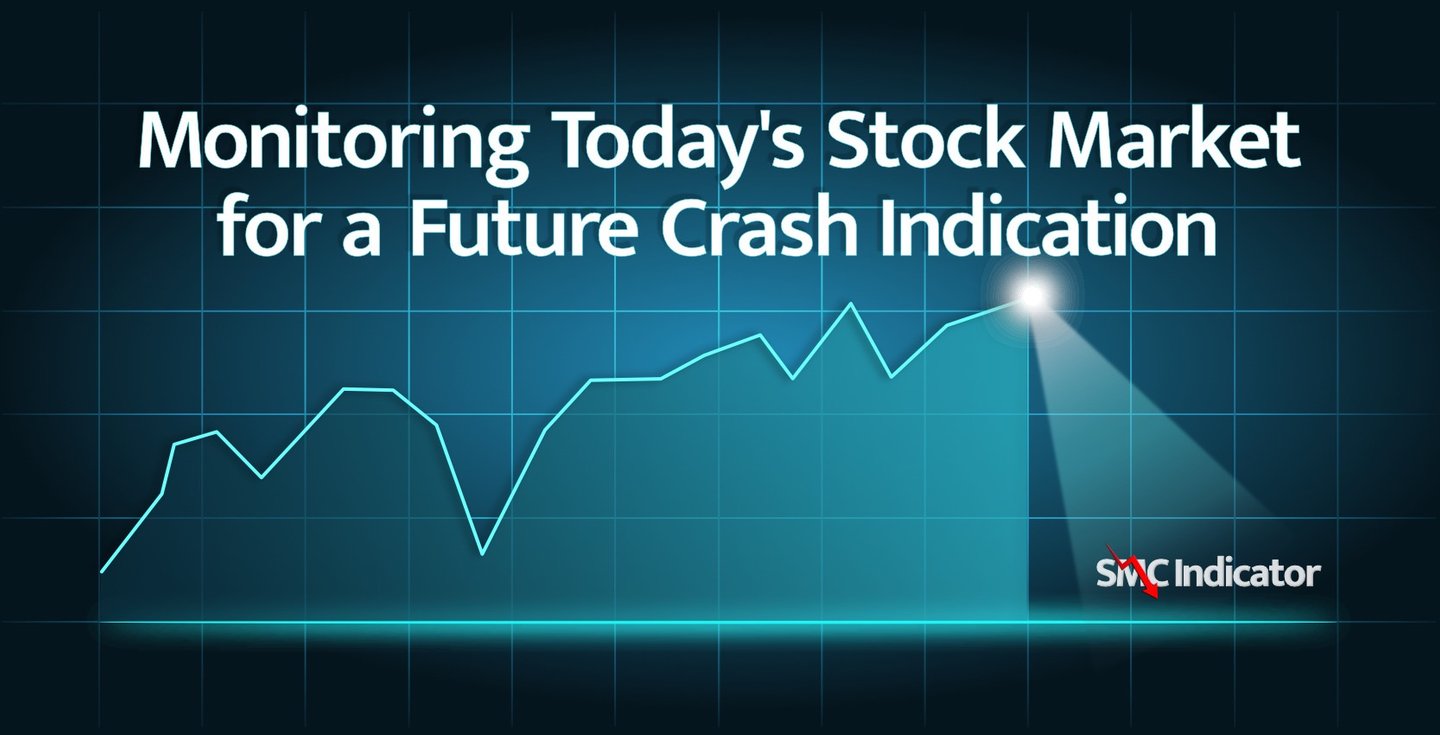
The Stock Market Crash Indicator (SMC Indicator) is an app designed to serve as an early warning indicator for the next major market crash. The SMC Indicator gauges the next most likely market pullback for the entire U.S. stock market. Get a preview of the next most likely downward market move with the Stock Market Crash Indicator.

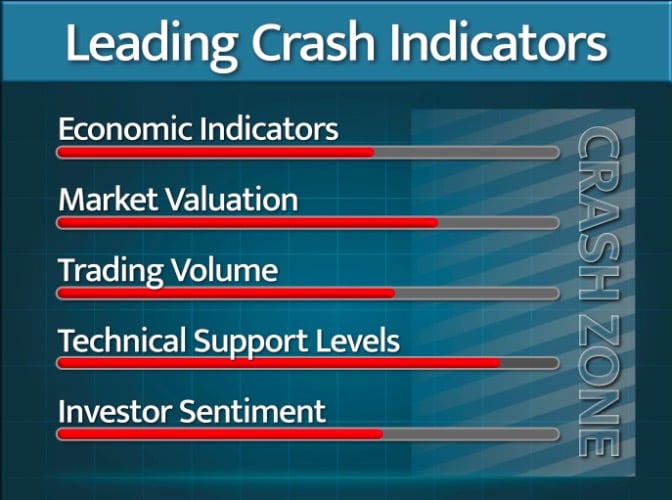
Five Leading Crash Indicators that warn of a major market decline
Our five leading market crash indicators closely monitor the potential risk of a significant stock market crash. When all five indicators reach the Crash Zone and at least one of them reaches its maximum value, it signals a potential stock market decline of 30-50%, which has occurred 13 times since the Great Depression. Gain valuable foresight into the next most likely stock market crash with the SMC Indicator.
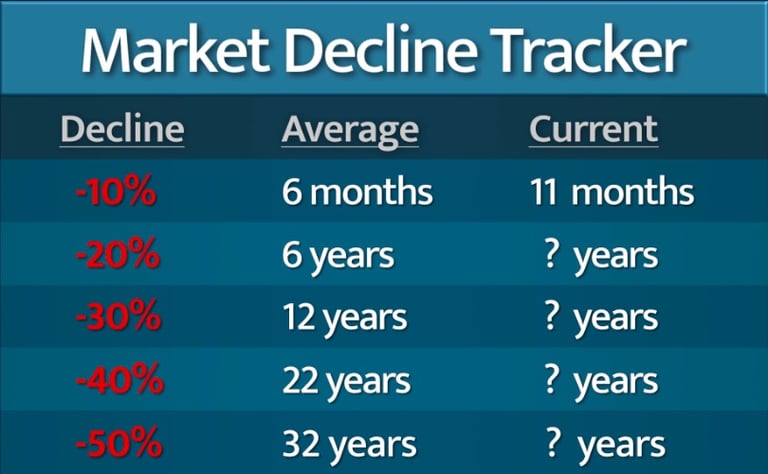
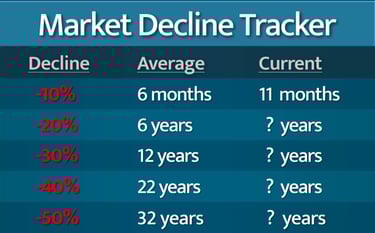
Stock Market Decline Tracker
The Market Decline Tracker (MDT) lists the average amount of time in between certain percentage declines in the stock market. The MDT also indicate the Current amount of time since a certain percentage decline. Gain valuable insight into when the next stock market decline is due to repeat.
Stock Market Crash Indicator is available on your favorite app store
Download the Stock Market Crash Indicator from your favorite App Store today.